Uber Rides
Displays all of the Uber rides in New York City in 2014. Pandas on the backend filters a 0.5gig datafile. Source Code.
- from
- Dash
- added
- 2026-10-10
- likes
- 0
similar
-
webapp metrotransitmn.shinyapps.io
, GitHub) - An R Shiny app to ingest ridership time series, and return seasonal, trend, and residual components according to STL methodology and forecasts including uncertainty based on those components. Sponsored by Metro Transit (Minneapolis-St. Paul).
-
NYC Taxi Visualization Blog chriswhong.github.io
-
Uber github.com
-
CityBikes api.citybik.es
REST API for aggregated bikeshare data from around the world. Powered by pyBikes.
-
citi_bike.js gist.github.com
Shows availabilities for NYC's bicycle sharing program.
-
Visualizing MBTA Data mbtaviz.github.io
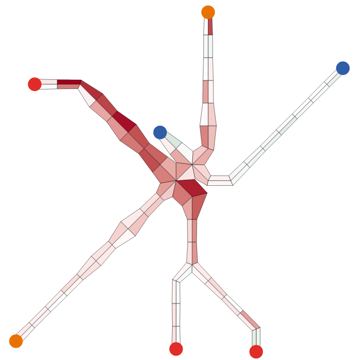
Interactive graphs that show how people use Boston's subway system.

Dash › App Examples: “Displays all of the Uber rides in New York City in 2014. Pandas on the backend filters a 0.5gig datafile. Source Code.”