webapp
, GitHub) - An R Shiny app to ingest ridership time series, and return seasonal, trend, and residual components according to STL methodology and forecasts including uncertainty based on those components. Sponsored by Metro Transit (Minneapolis-St. Paul).
- from
- Transit
- added
- 2026-10-10
- likes
- 0
similar
-
-
Transit Vis github.com
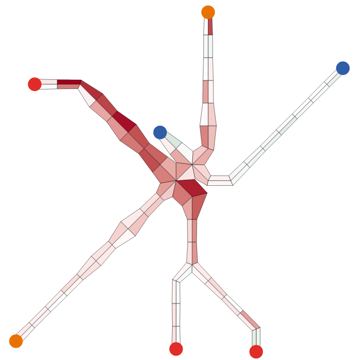
A visualization tool to display performance metrics derived from the King County Metro GTFS-RT feed (OneBusAway API). Viewable here. Used for this paper.
-
Croquis github.com
An open-source R package and Shiny web application for transit sketch planning and GTFS production and editing. Users can upload an existing GTFS file or rapidly create one from scratch on an interactive map interface.
-
Visualizing MBTA Data mbtaviz.github.io
Interactive graphs that show how people use Boston's subway system.
-
tidytransit github.com
Use tidytransit to map transit stops and routes, calculate travel times and transit frequencies, and validate transit feeds. tidytransit reads the General Transit Feed Specification into tidyverse and simple features data frames.
-


Transit › Using Data > Agency Tools: “, GitHub) - An R Shiny app to ingest ridership time series, and return seasonal, trend, and residual components according to STL methodology and forecasts including uncertainty based on those components. Sponsored by Metro Transit (Minneapolis-St. Paul).”