Miscellaneous
17,439 items in 132 lists
-
Single Cell VR singlecellvr.herokuapp.com
Interactive visualization of single-cell data in virtual reality.
-
Signal signal.mutationalsignatures.com
Mutational signatures extracted from cancer samples and isogenic cell-based experiments.
-
SieveSifter sieve.fredhutch.org
Tool for visualizing the sieve analyses of HIV-1 vaccine efficacy trials.
-
TADkit sgt.cnag.cat
3D genome browser and TADbit front-end.
-
SCope scope.aertslab.org
A visualization tool for large-scale scRNA-seq datasets.
-
EzMol sbg.bio.ic.ac.uk
Visualisation and image production of protein and nucleic acid structures.
-
Malaria Cell Atlas sanger.ac.uk
Explore how genes are expressed across more than 500 individual Plasmodium parasites.
-
Life Expectancy projects.flowingdata.com
Life expectancies around the world, 1960 to 2009.
-
Archaeopteryx phyloxml.org
Visualization, analysis, and editing of phylogenetic trees.
-
PhyD3 phyd3.bits.vib.be
A phylogenetic tree viewer.
-
pdb2print pdb2print.org
Convert a PDB structure into a 3D-printable 3MF file, with one object per chain, magnet pockets and custom display stands.
-
Oncoscape oncoscape.sttrcancer.org
An integrated suite of analysis tools for users to explore hypotheses related to molecular and clinical data.
-
Nextstrain nextstrain.org
Real-time tracking of virus evolution.
-
Mouse Brain Atlas mousebrain.org
Atlas of cell types from the Linnarsson Lab.
-
Metaviz metaviz.cbcb.umd.edu
Interactive statistical and visual analysis of metagenomic data.
-
Metaspace metaspace2020.eu
A platform for metabolite annotation of imaging mass spectrometry data.
-
GIVe mcf7.givengine.org
Epigenome and genome interaction.
-
iSEE marionilab.cruk.cam.ac.uk
The Interactive SummarizedExperiment Explorer.
-
MAGI magi.brown.edu
Visualization and collaborative annotation of genomic aberrations.
-
Clustergrammer CCLE Explorer maayanlab.github.io
Browse relative mRNA expression data for cancer cell lines from the Cancer Cell Line Encyclopedia (CCLE) by tissue of origin using Clustergrammer.
-
Clustergrammer maayanlab.cloud
Visualize high-dimensional data as interactive hierarchically clustered heatmaps.
-
Loom Viewer loom.linnarssonlab.org
Tool for sharing, browsing and visualizing single-cell data stored in the Loom file format.
-
SPRING kleintools.hms.harvard.edu
A tool for uncovering high-dimensional structure in single-cell gene expression data.
-
cellxgene kidneycellatlas.org
An interactive explorer for single-cell transcriptomics data.
-
START kcvi.shinyapps.io
Shiny Transcriptome Analysis Resource Tool allows users to visualize RNA-seq data starting with count data.
-
Brain mRNA Isoform Atlas isoformatlas.com
Visualize cell type signatures of alternative splicing in postnatal development.
-
IONpath MIBItracker ionpath.com
Slide and image data.
-
Snake Oil Supplements informationisbeautiful.net
Scientific evidence for popular health supplements.
-
IMP: Integrative Multi-species Prediction imp.princeton.edu
Analyze your experimental results in the functional context of gene-gene networks from multiple organisms.
-
HiPiler hipiler.higlass.io
A tool for visually exploring and aggregating reoccurring patterns (like loops, TADs, etc.) in Hi-C maps.
-
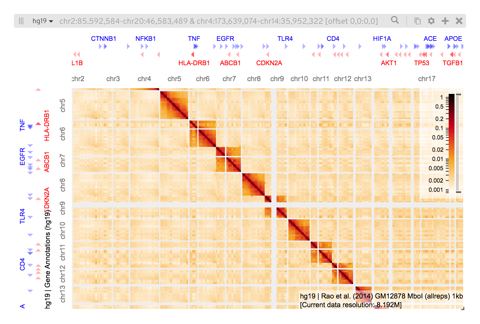
HiGlass higlass.io
A tool for exploring genomic contact matrices and tracks.
-
neuroglancer hemibrain-dot-neuroglancer-demo.appspot.com
Tool for visualization of highly detailed maps of neuronal connectivity in the fly brain.
-
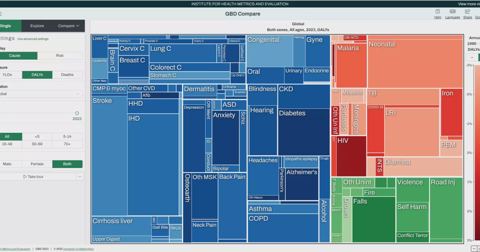
Institute for Health Metrics and Evaluation healthdata.org
Visualizations of disease worldwide.
-
Gosling gosling.js.org
A grammar-based toolkit for scalable and interactive genomics data visualization.
-
GeneMANIA genemania.org
Helps predict the function of genes and gene sets.
-
Genomics 2 Proteins portal g2p.broadinstitute.org
A platform for connecting genomic data to protein sequence and protein structure.
-
FlyWire flywire.ai
A human-AI collaboration to map the fly connectome.
-
gbatlas fishka.bio
Interactive viewer for GenBank/GenPept records: linear and circular feature maps, CDS translation, ORF and restriction-site layers, entirely in the browser.
-
iCoMut Beta for FireBrowse firebrowse.org
Interactive exploration of mutation rates, mutation signatures, clinical data, gene mutations.
-
ExploSig explosig.lrgr.io
Interactive visualization of mutational signatures and clinical data.
-
Epiviz epiviz.cbcb.umd.edu
Interactive visual analytics for functional genomics data.
-
WashU Epigenome Browser epigenomegateway.wustl.edu
Displays many sequencing-based data sets across all or part of the genome, on specific gene sets or pathways, and in the context of their metadata.
-
Race, Gender, and Age in TCGA enpicom.com
An interactive visualization of patient gender, race, and age in The Cancer Genome Atlas (TCGA) dataset.
-
Mutaframe deogen2.mutaframe.com
Visualize variants of the human genome.
-
Delta delta.big.ac.cn
An integrative analysis and visualization platform for 3D genome.
-
Cytosplore cytosplore.org
Cytosplore is an interactive visual analysis system for the analysis of mass cytometry data.
-
Lifespans cotrino.com
Visualization of the lifespans of multiple species.
-
Allen Mouse Brain Connectivity Atlas connectivity.brain-map.org
A high-resolution map of neural connections in the mouse brain.
-
Coessentiality coessentiality.net
A genome-wide almanac of co-essential modules assigns function to uncharacterized genes.
-
Allen Brain Map - Transcriptomics Explorer celltypes.brain-map.org
Atlas of human and mouse transcriptomic cell types.
- next page of items loading…