Miscellaneous
17,439 items in 132 lists
-
An Introduction to Systems & Service Monitoring with Prometheus youtube.com
GOTO 2019: An Introduction to Systems & Service Monitoring with Prometheus - Julius Volz.
-
Infrastructure and application monitoring using Prometheus youtube.com
Devoxx - May 17, 2017 at Devoxx UK - Marco Pas.
-
PromCon 2019 youtube.com
PromCon Munich - November 7-8, 2019, PromCon EU 2019.
-
PromCon Online 2020 youtube.com
PromCon Online - July 14-16, 2020.
-
PromCon 2018 youtube.com
PromCon Munich - August 9-10, 2018 - talk recordings from PromCon 2018 in Munich.
-
PromCon 2016 youtube.com
PromCon Berlin - August 25-26, 2016 - talk recordings from PromCon 2016 in Berlin.
-
PromCon 2017 youtube.com
PromCon Munich - August 17-18, 2017 - talk recordings from PromCon 2017 in Berlin.
-
Practical Services Monitoring with Prometheus and Docker web.archive.org
Practical services monitoring with Prometheus and Docker by Simon KP.
-
Prometheus and Kubernetes: A Perfect Match weave.works
Part 1 of 3 in the series Prometheus and Kubernetes.
-
Prometheus and Kubernetes: Deploying weave.works
Part 2 of 3 in the series Prometheus and Kubernetes.
-
Prometheus and Kubernetes: Monitoring Your Applications weave.works
Part 3 in the series Prometheus and Kubernetes.
-
Explain it Like I'm Five - What I Learned Teaching Observability to My Kids vimeo.com
Monitorama PDX, 2019 - Dave Cadwallader.
-
Prometheus on FLOSS Weekly 357 twit.tv
Julius Volz on the FLOSS Weekly TWiT.tv show.
-
Kubernetes monitoring with Prometheus, the ultimate guide sysdig.com
Kubernetes monitoring with Prometheus, the ultimate guide by Mateo Burillo.
-
Setting up Prometheus Monitoring On a Kubernetes Cluster spacelift.io
Setting up Prometheus Monitoring On a Kubernetes Cluster by James Walker.
-
Prometheus Monitoring with Brian Brazil softwareengineeringdaily.com
Brian Brazil on the Software Engineering Daily podcast.
-
Prometheus Overview slideshare.net
The Promethean ideal of monitoring by Brian Brazil.
-
System Monitoring with Prometheus slideshare.net
Brian Brazil at Devops Ireland Meetup, Dublin.
-
Prometheus: Up & Running shop.oreilly.com
Prometheus: Up & Running by Brian Brazil.
-
Robust Perception robustperception.io
Multiple blog posts about Prometheus by Brian Bazil.
-
Checking if SSH is responding with Prometheus robustperception.io
Walkthrough on how to use the Blackbox Exporter to check if SSH is responding by Brian Brazil.
-
Prometheus Monitoring subreddit reddit.com
Subreddit collecting all Prometheus-related resources on the internet.
-
Monitoring with Prometheus prometheusbook.com
Monitoring with Prometheus by James Turnbull.
-
Grafana prometheus.io
Grafana is an open-source metric analytics & visualization suite tutorial by Prometheus.
-
Documentation prometheus.io
Official Prometheus documentation.
-
Blog prometheus.io
Official Prometheus blog.
-
PromCon promcon.io
The Prometheus conference.
-
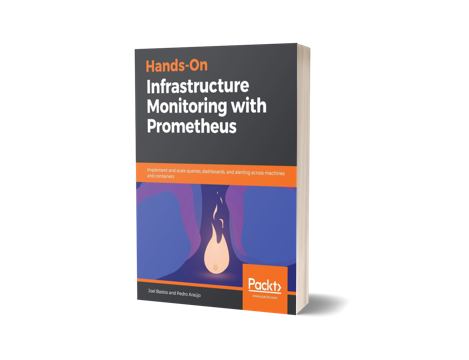
Hands-On Infrastructure Monitoring with Prometheus prombook.info
Hands-On Infrastructure Monitoring with Prometheus by Joel Bastos & Pedro Araújo, reviewed by Brian Brazil.
-
Prometheus Blog Series (Part 4): Instrumenting code in Go and Java pierrevincent.github.io
Part 4 in the series Prometheus Blog Series by Pierre Vincent.
-
Prometheus Blog Series (Part 3): Exposing and collecting metrics pierrevincent.github.io
Part 3 in the series Prometheus Blog Series by Pierre Vincent.
-
Prometheus Blog Series (Part 2): Metric types pierrevincent.github.io
Part 2 in the series Prometheus Blog Series by Pierre Vincent.
-
Prometheus Blog Series (Part 1): Metrics and Labels pierrevincent.github.io
Part 1 in the series Prometheus Blog Series by Pierre Vincent.
-
Learn Prometheus pagertree.com
A crash course of Prometheus by PagerTree LLC.
-
Prometheus Monitoring Tutorial (10 minutes) pagertree.com
Simple tutorial to create a Prometheus monitoring stack with Grafana, AlertManager, and PagerTree by Austin Miller.
-
Monitoring mixins monitoring.mixins.dev
Community managed bundles of alerts, recording rules, and Grafana dashboards.
-
Simple Prometheus queries for metrics inspection mkaz.me
Overview of PromQL queries that help to identify high cardinality metrics by Michal Kazmierczak.
-
Docker daemon metrics in Prometheus medium.com
Docker daemon metrics in Prometheus by Luc Juggery.
-
PromQL tutorial for beginners medium.com
PromQL tutorial for beginners by Aliaksandr Valialkin.
-
Prometheus storage: technical terms explained medium.com
Prometheus storage: technical terms for humans by Aliaksandr Valialkin.
-
Initial experiences with the Prometheus monitoring system medium.com
Initial experiences with the Prometheus by Grig Gheorghiu.
-
Prometheus Monitoring with Grafana logz.io
Prometheus Monitoring with Grafana tutorial by logz.io.
-
Horizontal Pod Autoscaling in Kubernetes with Prometheus livewyer.io
Horizontal Pod Autoscaling in Kubernetes with Prometheus by Louise.
-
Click-to-deploy Prometheus github.com
Source for Google Click to Deploy Prometheus solutions listed on Google Cloud Marketplace by GoogleCloudPlatform.
-
Cloud Alchemy Ansible roles github.com
Ansible roles to manage Prometheus, Alertmanager, Grafana, and common Prometheus exporters.
-
Deploying Prometheus fosdem.org
Filippo Giunchedi, WikiMedia Foundation at FOSDEM 2017.
-
OMG! Prometheus dropbox.com
Benjamin Staffin, Fitbit Site Operations, explains the case for Prometheus to his team.
-
How to Use Prometheus to Monitor Your CentOS 7 Server digitalocean.com
Walkthrough on how to monitor a CentOS 7 server using Prometheus.
-
How To Install Prometheus using Docker on CentOS 7 digitalocean.com
Walkthrough on how to install Prometheus on CentOS 7.
-
How To Add a Prometheus Dashboard to Grafana digitalocean.com
Walkthrough on how to add a Prometheus dashboard to Grafana.
-
Prometheus: Monitoring at SoundCloud developers.soundcloud.com
Overview of Prometheus and first hand experience from Soundcloud.
- next page of items loading…