-
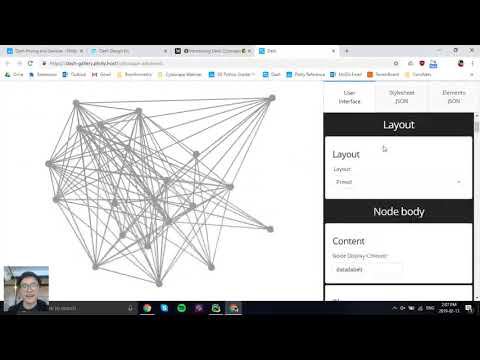
Dash Cytoscape Component youtube.com
Official introduction video to the Dash Cytoscape components.
-
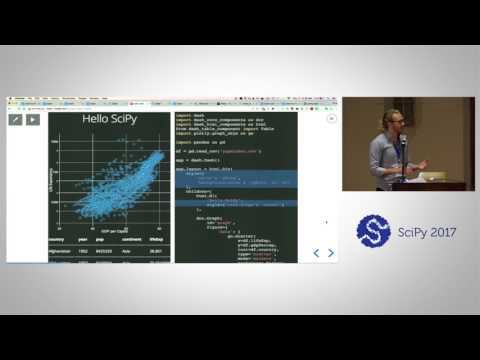
Overview of Dash youtube.com
Chris Parmer, creator of Dash (SciPy 2017).
-
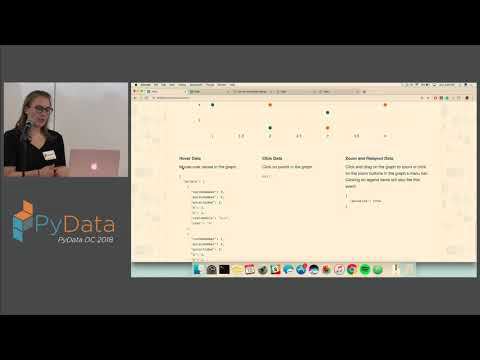
Dash: Data exploration web apps in pure Python youtube.com
Chelsea Douglas, PyData DC 2018.
-
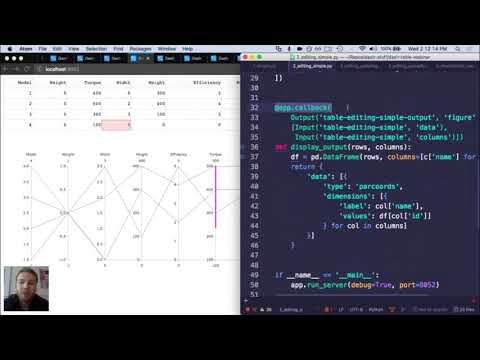
An introduction to Dash DataTable youtube.com
Official introduction video to the Dash DataTable components.
-
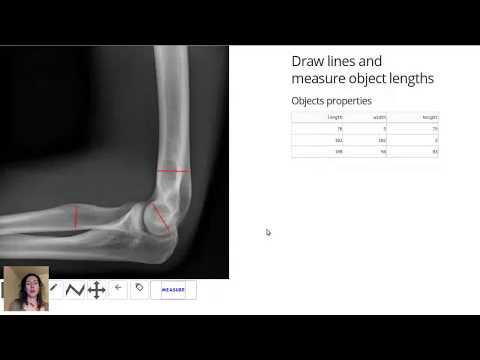
Interactive Image Processing with Dash-Canvas youtube.com
Official introduction video to the Dash Canvas components.
-
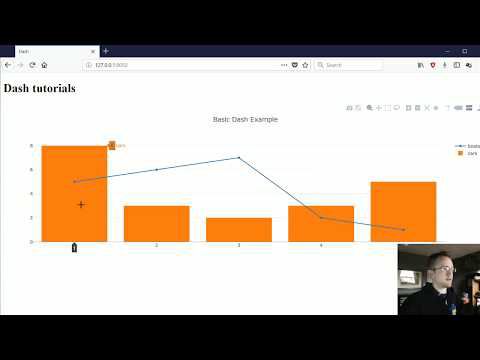
Data Visualization GUIs with Dash and Python (Video playlist) youtube.com
Five-part series exploring Dash features.
-
We're Launching Dash youtube.com
Chris Parmer, creator of Dash, speaking about the motivations behind Dash before it was launched (Plotcon NYC 2016).
-
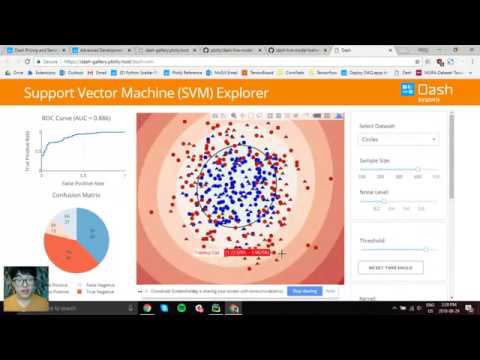
Interactive Visualization of Machine Learning and Computer Vision with Dash youtube.com
Official introduction video.
-
Charming Data YouTube channel youtube.com
A channel dedicated to teaching Dash and Plotly with over 25k subscribers.
-
Stack Overflow stackoverflow.com
-
Plotly dash and data visualisation in Python, PyData, Berlin 2017 slideshare.net
Volodymyr Kazantsev (slides only).
-
OPS CodeDay: Dash Plotly Map + Graph radumas.info
How to use Jupyter notebooks in tandom with Dash to create mapping viz.
-
Ploomber Cloud ploomber.io
The community plan allows free deployments
-
Creating Interactive Visualizations with Plotly's Dash Framework pbpython.com
High level overview of how to get started with Dash.
-
Pascal Bugnion pascalbugnion.net
-
Using Plotly's Dash to deliver public sector decision support dashboards medium.com
Building a complex dashboard step-by-step.
-
Introducing Plotly Dash medium.com
A high level introduction to Dash by Chris Parmer, the author of Dash. This essay was released as part of Dash's official launch (June 21, 2017).
-
Luke Singham lukesingham.com
-
plotly.py Cheat Sheet images.plot.ly
-
GutenSearch gutensearch.com
Look inside the books of Project Gutenberg. Source Code.
-
vaexio github.com
-
Snehil Vijay github.com
-
Fanchao MENG github.com
-
Sergey Pikhovkin github.com
-
Florian Kromer github.com
-
Eduardo Blancas github.com
-
Chris Parmer github.com
-
Dash Data Dashboards and Apps dashboardom.com
Collection of data dashboards with real life data, for various topics, as well as a few apps for online marketing built with Dash.
-
Plotly's tutorials - Part 4: Callbacks With State dash.plotly.com
-
Tutorial on creating custom Dash components with React.js. dash.plotly.com
-
Plotly's tutorials - Part 1: App Layout dash.plotly.com
-
Plotly's tutorials - Part 3: Interactive Graphing dash.plotly.com
-
Dash DataTable Component dash.plotly.com
Interactive table that supports rich styling, conditional formatting, editing, sorting, filtering, and more.
-
Dash DAQ Components dash.plotly.com
Set of controls that make it simpler to integrate data acquisition and controls into your Dash applications.
-
Dash Cytoscape Component dash.plotly.com
Graph visualization component for creating easily customizable, high-performance, interactive, and web-based networks.
-
Dash Canvas Components dash.plotly.com
Module for image annotation and image processing using Dash.
-
Plotly's tutorials - Part 2: Interactivity dash.plotly.com
-
3D Yield Curve dash.gallery
Adapted from NYTimes's excellent A 3-D View of a Chart That Predicts The Economic Future: The Yield Curve. Source Code.
-
Live Wind Streaming dash.gallery
Continually queries a SQL database and displays live charts of wind speed and wind direction. Source Code.
-
Uber Rides dash.gallery
Displays all of the Uber rides in New York City in 2014. Pandas on the backend filters a 0.5gig datafile. Source Code.
-
Oil and Gas Explorer dash.gallery
Explore oil and gas production over time and with linked visualisations. Source Code.
-
Drug Discovery dash.gallery
Displays a description of the drug as you hover over points in the graph. Source Code.
-
Dash Gallery dash.gallery
A collection of Dash apps.
-
Visualize Earthquakes with Plotly Dash dash-earthquakes-production-45eyyotfta-ey.a.run.app
Great UI and usage of geospatial analytics with Dash. Includes basic unit tests. Source Code.
-
dash-bootstrap-components dash-bootstrap-components.opensource.faculty.ai
Bootstrap components for Dash.
-
Plotly hosted Question and Answer community community.plot.ly
-
Interactive Web-Based Dashboards in Python alysivji.github.io
How the MVC model pertains to Dash and a walkthrough of building an app.
-
Aly Sivji alysivji.github.io
-
Vert.x Youtube channel youtube.com
-
Introduction to Vert.x vertx.io
- next page of items loading…